Blogger Syntax Highliter
Friday, 1 May 2009
Animated walkers
we all walked together
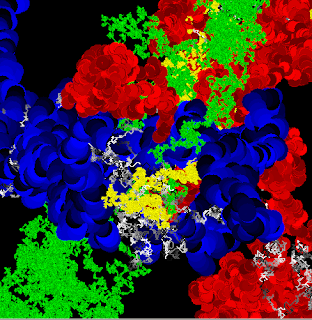
It would be nice to have each walker able to walk around with its own rules for how to colour, but this is hard to do without an OO structure, and readers won't have read the OO stuff by the time they get to my chunk.
I've wound up creating an array for each walker, containing its integer data: its weight, (x,y) position, R, G, B, colours, and direction. Then each walker can have its own function to keep updating these. The main loop can call one function for each walker. It's not ideal, but without an OO structure it's the best I can come up with at this point
Here's an example image with different walkers using different rules, although they are all pretty similar to one another in their rules for what to do at each iteration. (It's not obvious how to refactor that similar code without getting hopelessly complex at this point...)
Tuesday, 28 April 2009
Still just points

Monday, 27 April 2009
Simple palettes for random walkers
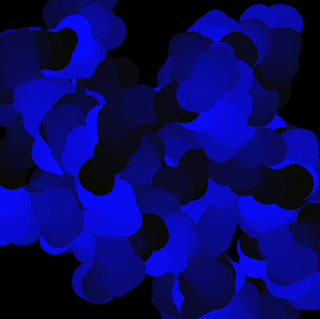
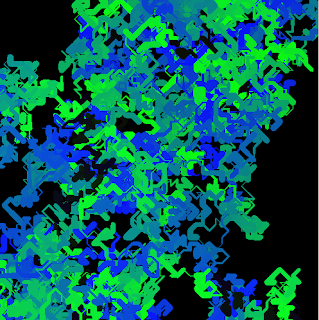
A lazy way of constructing a sort of a palette is to fix some of the RGB palette and constrain the variation in other parts of the components. Here, for example, is a greenish walker, with stroke weight 10.
This means that R is constrained to be fairly high, from 100-255, while green is subdued, and B is low to middling. I chose these without a great deal of thought, but obviously you can make one or another component the predominant colour.
Tuesday, 31 March 2009
Random Walker with better colours
Well, I give up on IE, and I give up on Firefox. IE gives me endless empty lines, and Firefox won't load images. So let's try Chrome.
One of the simple enhancements to the random walker code is to choose better colours, and to vary the colours in interesting ways.
Also, for more variability in direction, you can choose from eight directions instead of four.
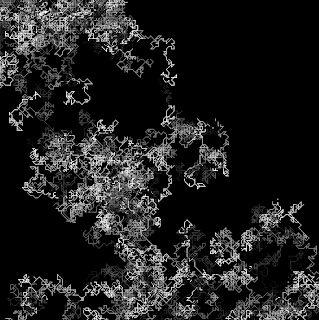
Here is an example picture in which the colour is rotated through shades of grey (from 0, which is black, to 255, which is white) repeatedly.
This uses 8-c (eight directions to walk in) and a step size of 1 (i.e., the walker can change direction after a single pixel movement).
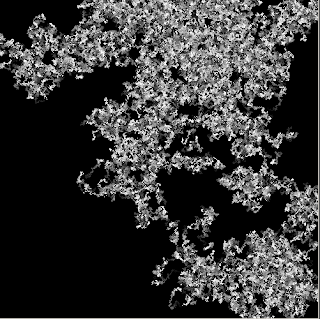 Figure N: Grey walker...
Monday, 30 March 2009
The curious case of the random walker
Friends, have you ever had one of those nights when you just can't find your way home? Have you ever walked from Leith to Land's End, trying to find a black cab? Have you ever measured distance in pints (or points)? If so, your path might have looked like this:
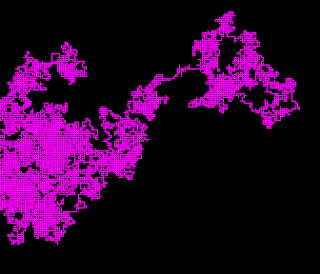
Figure 1: A random walker
Surprisingly, the path of an individual who has had one glass too many can make for an interesting picture. So let's so how we can do it.
First of all, it's nowt but points, all the way down. So, all we need to do is show how you plot one point after another, following a path that can vary
rather radically from one moment to the next.
It's useful to know at this pint that one point is one pixel, and pixels are rectangular, in fact, more or less square. So, each pixel has a certain number of neighbours, which it more or less touches. There are two traditional notions of this connectedness, as we call it, and they are sometimes known as 4-c and 8-c. Here is a picture of 4-c.
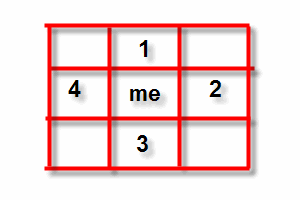
Figure 2: 4-connectedness
So, there you are, a lone point on an endless grid system, and who is around you but your connected pixel neighbours. To your north, number 1, to your east number 2, to your south number 3 and to your west number 4. That's 4-connectedness. And you could go any of those directions.
You should be able to figure out pretty quickly what 8-connectedness means, because there are four unlabelled pixels in that picture. If you prefer, you can consider those other four diagonally connected pixels to be connected as well. That's 8-c. Simple enough. The numbering of the individual pixels isn't important. What matters is that you could go four (or eight) different ways from where you are, if you take a single step.
Now, suppose that we plot where you are, and then plot every other pixel you walk to, on a random walk. Also suppose, for the time being, that you can go to any of those four connected neighbours.
Depending on your sobriety, at every step you take you might change direction, or you might wander in straight lines for a while before lurching off in another direction.
Given that your current position is (x,y), the directions you might go next are illustrated in Figure 3, based on a graphical coordinate system, in which x increases to the right, and y increases as you go down.
Figure 3: Your four neighbours
I think it's time for some processing routines...
First of all, to do this we need to be able to randomly pick a direction to go. We can write that very easily in a little function as follows:
int newDirection4(){ return (int) random(4); }
This returns 0, 1, 2 or 3. That's four numbers. We can say that 0 is north, 1 is east, 2 is south, and 3 is west.
Also, if we start at a point x, we can get a new point x based on those directions as follows:
Point newPoint4(Point oldPoint, int direction)
{
Point temp = oldPoint;
switch(direction)
{ case 0 : //north
{ temp.y = temp.y - 1; break;
}
case 1 : //east
{ temp.x = temp.x + 1; break;
} case 2 : //south
{ temp.y = temp.y + 1; break;
} case 3 : //west
{ temp.x = temp.x - 1; break;
}
}
return temp;
}
[Yes, I know that's a case statement. YOu could do an if too of course. Have we done these yet?]
The thing to notice here is that you return a point that changes either x or y by one pixel, depending on the choice of direction.
Then you plot the next point.
Now repeat! That's almost it. What else could you do? There are quite a few things you can do to liven this up:
- pick a different colour every so often, or for each different random walker
- iterate this for a certain number of iterations, or until some condition occurs, such as bumping into another walker
- change colour every so often
- change how often you change direction, perhaps even depending on how many points you've had.
- do different things when you bump into an existing path (either your own, or another walker's)
- change the size of a "point", for example, increase the stroke width to 2 or more.
One thing you will certainly have to incorporate is rules for what you do when you reach a "wall". By wall, I mean the edge of the area that we have decided to show, such as a 500 x 500 grid. The thing is, there's no point wandering off beyond this grid and plotting where you are, because you will no longer be visible. So, to remain visible, you could, for example, reflect off the wall, or you could "wrap around" and reappear on the other side of the grid. I prefer the "reflecting" or "bouncing" option.
To bounce, you need a rule implemented in a method like this:
Point bounce(Point p){
if (p.x > WIDTH)
{ --p.x; }
else if (p.x <> //munged on paste
{ ++p.x; }else if (p.y > HEIGHT)
{ --p.y; }
else if (p.y <> //mangled code on paste
{ ++p.y; }return p;
}
If you do this after you compute a new point, you will be able to correct your position so that you do not plot points that are off the grid.
The image in figure 1 is formed from a random walk in which the direction was changed every 2 steps. And, of course, if you pick direction randomly, you will get a different picture every time.
Here is an example of a top-level function that calls the other functions I've mentioned. You could invoke this with an argument of the order of 50,000, to get that many steps.void iterate(int iterations)
{
//start at middle
Point start = new Point(WIDTH/2,HEIGHT/2);
point(start.x,start.y);
int direction = newDirection4(); //random direction
for(int i = 0; i <> //huh? what happened to my code?
{if(i % STEPS == 0)
{ direction = newDirection4();
}
start = newPoint4(start,direction); System.out.println(start); point(start.x,start.y);
}
Let's see what happens if we increase the step size, so that the direction is only changed every four steps. We can do this in the above routine by setting STEPS = 4.
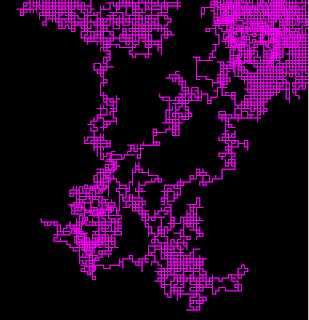 Figure 4: Purple random walker with STEPS == 4
Let's see what happens if we add another walker in orange, perhaps.
To do this, we might create an array of Points. The first point will represent the first walker, and the next the second walker. We can also change the colour of each walker by using an array of colours. We can use the same index into the two arrays.
At this point we will need to keep track of where each walker is and their colour, so I'll add a routine that can use those two pieces of information:
[what you really want here is a Walker class, but they haven't read the OO stuff yet... pity. This complicates things considerably. A side-effect of this is that you want to make all your variables global... However...]
So this code is pretty nasty, and a first draft, but we'll look at it again later to see what can be done for it...
void iterate()
{
//walkers starting positions randomly
for(int i = 0; i <>
{ walkers[i] = new Point((int) random(WIDTH), (int) random (HEIGHT));
directions[i] = newDirection4(); //each walker has a direction also
stroke(colours[i]); //this walker's colour
point(walkers[i].x,walkers[i].y);
}
//now let each walker go for a walk for a number of iterations - constants declared earlier...
for(int walkerNum = 0; walkerNum <>
{
for(int j = 0; j <>
{
showWalker(walkerNum, j);
}
}
}
void showWalker(int w, int its)
{
//naffly, each walker must have the same step size until I do better
if(its % STEPS == 0)
{
directions[w] = newDirection4(); //random direction
}
walkers[w] = newPoint4(walkers[w], directions[w]); stroke(colours[w]); //this walker's colour
point(walkers[w].x, walkers[w].y); //where has that walker got to now?
}
something like that anyway
And now you can get a picture like this
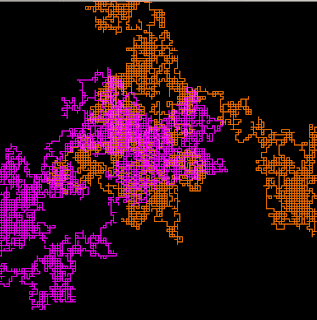
figure n : a fuchsia and an orange walker...
And here are four walkers...
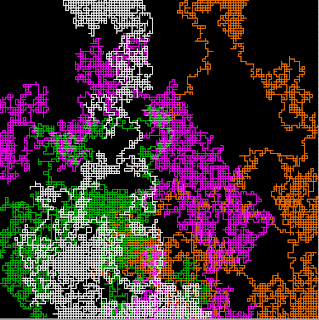 ffigure the next: Four random walkers, randomly walking
And now, it's time for a point.
This is ridiculous - I keep getting another 20 blank lines to delete... Maybe back to firefox again and a check on a pop up blocker? Because as it is, I can't go like this...
Friday, 20 March 2009
Chunk 35... a start
The point is the most basic element of drawing, so, although it might seem limiting to continue to think about drawing simply in terms of plotting points, the truth is there's nothing we can't draw with them.
Even so, how could one draw a complex picture like this using only points, and not a lot of talent?
xxx
Figure 1 - leaf/fern or similar
Fortunately, it will involve some lovely maths. Fear not.
First, consider the following much simpler figure.
xxx
Figure 2 - Straight line from points
You will see how to draw lines like this later on in the course using a different approach, where an output is generated from an input using a function such as y = 2x, where y represents a vertical coordinate, and x a horizontal one. The function y = 2x simply says that whatever x is, we can multiply it by 2 to find out what y is. So, if you choose the x values 1, 2 and 3, you will get the y values 2, 4 and 6, and that means you can plot the points (1,2), (2,4) and (3,6). Straight forward.
Think about it another way. if you start at (1,2) and add 1 to the x value, and 2 to the y value, you will find the next point, which is (2,4). And if you add 1 to the x value and 2 to the y value again, you will find the point (3,6). So, it is possible to think about a set of points as a relationship between an input point and an output point. In this case we have the relationship that if the input is (x,y), the next point is (x+1, y+2). This allows you to write a simple function like this
Point straightLine(Point in) { return new Point(in.x + 1, in.y + 2); }
If you call this function several times in a loop, you can plot the resulting points:
Point p = new Point(0,0); for(int i = 0; i <> { p = straightLine(p); //get a new p based on the old one point(p.x, p.y); }
Notice that on each iteration of this loop, we get a new point based on the value of the old one. We could also write this down in a more mathematical notation as follows:
(x',y') = (x,y) + (1,2), where x' is the new value of x, and y is the new value of y. A pairs of values in brackets can also be called a matrix.
When we add groups of values in matrices, we always add values in corresponding positions, so 1 gets added to x to find x', and 2 gets added to y to find y'.
If we repeat this process using the new point (x',y') as our input, we get the next point:
(x'',y'') = (x',y')+(1,2)
And so on.
So, it is possible to specify a whole set of points using just a few lines of code. Admittedly, the resulting picture here is not very exciting, but it helps to give you the idea. In fact, some functions will lead to very uninteresting pictures indeed! For example, suppose that we write a function that performs the following arithmetic:
(x',y') = (x,y) + (0,0)
If you think about this a while, you will realise that whatever the input point is, the output point is the same. That is (x',y') = (x,y). furthermore, (x'',y'') = (x',y'). So this makes the very uninteresting picture consisting of a single pixel at the point (x,y), whatever we choose x and y to be. The point is 'stuck' at its starting place. We say it is a fixed point.
While this example has all input values as fixed points,other functions may have fixed points for only some input values. Consider, for example,
out = 3*in - 2.
When in is 1, out is also 1. If we were to put the out value back into this function, it would only compute the value 1 again. This again is a fixed point of the function. (But other points, such as an input of 2, are not fixed.)
The next bit requires a bit of a leap of faith and some hand-waving. The thing is, whilst this fixed point is very uninteresting in itself, you can write very similar functions that consists of whole sets of points that collectively make beautiful pictures. They are also called fixed points, but the sense on this occasion is of a set of points, and the fixedness of these points is within the set. For example, suppose we have the set of points, let's call it P = {(1,2), (2,5) , (3,6)} and a pseudo Processing function
Point magic(Point in) { if (the input is in P) { return another point in P; } else { return a point closer to the points in P; }
}
Now it should be possible to have a really interesting or beautiful set of points P. Furthermore, we should be able to pick a point (any point, nothing up the sleeve) and "pretty soon" we should get a point back that is in the set P. Once we do have a point in P, we can start plotting them, and then we should get a really interesting or beautiful picture.
It may appear, and you'd be right, that I have still avoided the crucial question of how you come up with the interesting set of points P. How, for example, would one get a set of points to create a picture of a leaf?
This is the bit you will have to take on faith, unless you would like to explore the maths more deeply. There is a theorem, called the collage theorem (magicked by a magician called Barnsley), which tells you how to construct such a set of points. The trick is that you have first to imagine the shape you want to draw, and then imagine how you would twist, turn, shrink or grow that shape, in order to make copies of itself that fit on top of itself. What? Did I just say that? Yes, a bit like this:
xxx
Figure 3 A picture we can make some sense of in terms of collage
And now I probably need to use IExplorer as blogger won't let me load images in firefox today...
It is getting a little trickier than I thought it might. At least, how will readers write their own IFS without understanding collage.... does it matter... should I do something simpler like a random walk?
Some of this discussion probably would be better off in the previous chunk.
Monday, 23 February 2009
Strange attractors
In an iterated function system, particularly the random iteration algorithm, you pick a point, any point (nothing up the sleeve) and watch as it magically gets sucked into this attractor. Then the point hops around the attractor forever, apparently randomly moving about, but otherwise very nicely confined and constrained.
We don't tend to plot the first 10 iterations or so. This seems rather arbitrary, but I've not yet found a good explanation for how we decide when to start plotting.
What's the simplest attractor you could have? f(x) = 0? Ah, so f(0) = 0 is a fixed point of this system. And, f(x) = x has all points as fixed points. So we can explain that for some systems the set of fixed points has an interesting shape. Also that after a while we can remain on that shape, if we start out close enough to it to get sucked in by its 'gravitational pull'. What would that look like?
Pendulum? Not very interesting - its fixed point must be its bottom point. But it's a helpful analogy for thinking about attractors as fixed points, which is what IFSs are, except that they are sets of points. I don't want to get too mathematical.
Could do the Cantor set, I suppose, or an IFS to draw a line or a square or some such thing. The former is probably too abstract. The latter is visually uninteresting, but at least you can plainly see the attractor.
Hmm... more reading required.
Mass writing about processing
The great thing is that you can drop in Java code - it's Java underneath - and start drawing pictures within minutes. This is like BASIC used to be. Drawing lines and circles and what have you, sticking them in loops, changing the colours and widths of lines, all that fun stuff, without ever writing a paint method. But lots more, because you have all that Java power at your disposal and because they've thought about all the useful things you might like to do, like change transparency, or rotate and so on.
It looks like it will be fun. I have a mind to write something about Iterated Function Systems, taking me back to my days drawing fractals out of Barnsley's Fractals Everywhere book. It has not taken long to write my first attempts at that. Now I need to turn it into something accessible and fun to experiment with.
738683
I thought I'd dropped into an episode of Twin Peaks. There were dwarves break dancing. A leering man tapped me on the shoulder and said something backwards, before dancing tip toe out of the room. A strangely blue girl lay on my bed. Doves flew in my face and somebody spat a cherry pip at me.
Apparently this is how one starts a blog.


